Q2 2024 Market Update
Striking the Right Balance
Written by: Ryan Bouchey, Chief Investment Officer
2024 First Half Update
Recently, I’ve been thinking about the word nuance as it relates to the markets given some of the recent volatility we’ve seen these past few weeks. Headlines are an easy way to sell the news, and oftentimes, especially with the markets, they limit the nuance behind market performance and what’s actually happening. They are usually comprised with simplistic conclusions, “every time X has happened, Y is the outcome.” It’s no secret that these types of headlines can drive potentially damaging and harmful investor behavior.
Markets are complicated and evolve over time. Determining how markets perform cannot be based on a single data point or a simple conclusion. If you were to use history as your only defining reference point to determine what the market will do next, it would eliminate the role nuance plays in the market. I see nuances in the market as subtle changes that aren’t inherently good or bad. They are variables that vary widely that can help us assess our exposure to risk or determine opportunities within the market. When we make portfolio decisions, especially as of late, nuance within the markets plays a critical role as we look out into the horizon and what lies ahead. And through this nuance, striking the right balance is key in our minds.
U.S. Equities
U.S. equities are off to another fantastic start at the midway point of 2024, with many of the same trends we saw in 2023 holding steady. With that said, we have seen some major rotations taking place in the last week or two that may lead investors to question what’s ahead. We are starting to see some weakness in the first half winners, and strength coming from many weaker areas of the market. In Q1 we saw a widespread rally in stocks which became much more concentrated in the second quarter. And now as we’re a few weeks into the second half of the year, we’re seeing some market breadth in ways we haven’t seen in the past year and a half.
The S&P gained 3.9% in the 2nd quarter, and the tech sector was responsible for the entire gain. In fact, their share of gains for the overall S&P 500 was 4.3%. For the first half of the year, only technology and communications (mainly Facebook & Google) outperformed the S&P, and just barely, with both sectors being up 17% compared to the S&P being up 15%. All other sectors combined were up an average of 5.2%. So much for diversification!
The Chart below indicates just how low the recent correlation between different asset classes has been, with big winners and some big stragglers relative to the S&P. A low correlation means the different asset classes are not moving together, while a higher correlation of 1.0 indicates that everything is moving together. Frankly, a low correlation can be a sign of a healthy market, especially at the current stage we are in with both the bull market and current economic backdrop, which we’ll get to later.
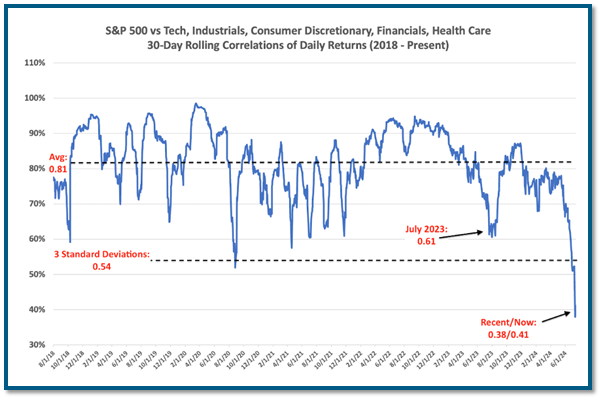
*DataTrek
Just as many investors may be getting complacent, or potentially greedy in this type of environment, the market has seen a dramatic shift in only the last few weeks. What’s the root cause for this? There’s no one simple answer, it’s a bit more nuanced. For starters, expectations of a fed cut have increased with lower inflationary readings and weaker labor numbers leading to a quick bounce back in small caps which tend to perform better with lower rates. We’ve seen a big lag of big-name tech companies this week, some of it can be traced back to political comments from both sides cracking down on chipmakers being able to ship goods to China. We’ve also gotten some clarity in the political markets that Trump is now the odds-on favorite to win the presidency, so there could be a slight “Trump trade” at works, although I think most of that is an optimistic view of economic strength. And lastly, it could be big asset managers pulling gains for winners and going towards some of the laggards from the first half.
Only time will tell, but this rotation we are seeing can be viewed as a positive. It does play into a theme we discussed at last week’s quarterly webinar. I shared the below chart because we keep hearing about the concerns with market concentration (At the highest it's been in over 60 years for the largest 10 companies in the S&P) and overall market valuations. However, when you strip out the 10 biggest companies, the S&P is fairly valued as a whole. It must be noted that now is the time to focus on proper diversification - not a time to be greedy. Allowing your portfolio to take advantage of growth but continuing to be positioned for any change to the market’s dynamics. Fortunately, our nuanced, strategic positions, which complement our biggest holdings of SCHB and QQQ, have done just that throughout the first few weeks of July. If we continue to see healthier market participation across the S&P, we can expect to see further strength and gains in these nuanced positions.
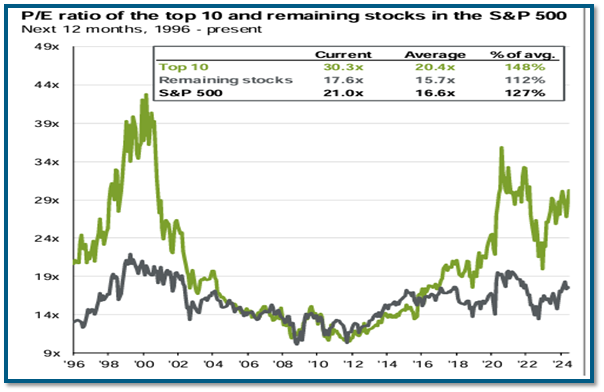
*JP Morgan Guide to the Markets
Economy & The Fed
I find myself wondering what’s left to be said about interest rates and the Fed that hasn’t already been discussed in great detail over the past 2-3 years. We know the impact that rates have had on the market, and it’s been on the mind of most investors since the Fed began raising rates in 2022 to combat inflation. 2022’s market decline and selloff, especially in hindsight, can mostly be attributed to the fears of a rising rate environment. But as we have seen since 2022 the economy has held up strongly making the market selloff in 2022 look like an overreaction.
There is a lot of criticism over how long it took the Fed to begin raising interest rates. Back in 2022, they viewed inflation as “transitory” and now in 2024 there is a potential of waiting too long to begin lowering rates as we continue to see inflation coming down. But let us not forget, the Fed was put in an almost impossible, and never before seen, position. You cannot overstate just how much Covid impacted the entire world financially and societally. Everything is crystal clear in hindsight, but having to navigate an unchartered situation in real-time is no easy feat. I don’t disagree that mistakes may have been made, but it’s more important to focus on where we are today.
For all the Monday morning quarterbacking that has been done, when we look at the situation today, the Fed is in line for the proverbial “soft landing” – lowering inflation without putting the economy into a recession. Now of course it's still early in this process but based on the data that is available to us, we are seeing many positives, with some potentially unintended and negative consequences (mostly home affordability in my mind). Recent CPI Inflationary data has been creeping lower, giving much optimism that rate cuts are on the way. The market currently views an almost 100% chance for cuts by September’s Fed meeting. Labor reports are cooling a bit, which is not surprising given inflation coming down. We felt this would be the leading indicator for both inflation and the overall economy. But even with some signs of weakness, the labor market is essentially at pre-Covid levels and seems to be in a more normalized environment versus the wild swings we saw post-Covid. To us, this feels like a good sign and helps support a soft-landing outcome.
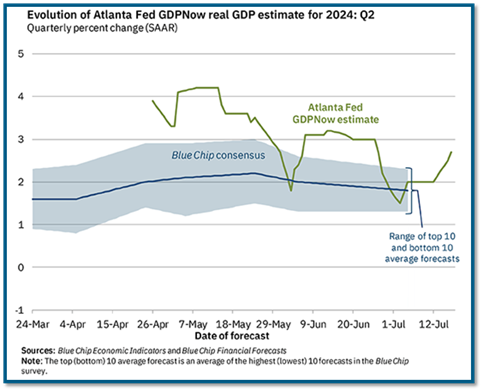
The chart below is from the Atlanta Fed and their estimate of 2nd Qtr. GDP. The growth forecast is now at 2.7%, which is still strong and above much of the readings we saw pre-Covid.
Closing Thoughts
I titled this quarterly report “Striking the Right Balance,” and to be honest this was before all the market volatility and fluctuations we’ve seen in the last two weeks. With the rotation we’ve seen, it doesn’t change the theme, but it may change the perspective. Many conversations I’ve had lately revolve around today’s biggest concern that the market has become overly concentrated and top-heavy. In the S&P 500 today, the top five holdings make up nearly 30% of the overall index, the highest concentration in the last 60 plus years. Not only that, but with this concentration and strong market performance by the biggest companies, we’ve had valuations in the S&P continue to expand beyond historical norms. As I pointed out in the Equity section earlier in this update, the rest of the S&P 500 is still trading just barely above historical averages and presents ample room for growth if we are indeed in the midst of a longer cycle bull market.
Because of these factors, I think they’ve played directly into the rotation we’ve seen to start the 3rd quarter these past few weeks. We’ve had some pretty significant pullback from the largest companies this past week, but with that we’ve actually had expanded market breadth, meaning that many smaller companies continue to post gains and are now participating in this market expansion. To us, this is a healthy sign and the reason why we’ve tried to strike the right balance. We want to participate in this market as the leaders do well, but also have the proper diversification to benefit from a market rotation like we’ve seen. This balance has been what we’ve tried to accomplish so far this year and have been quite happy with.
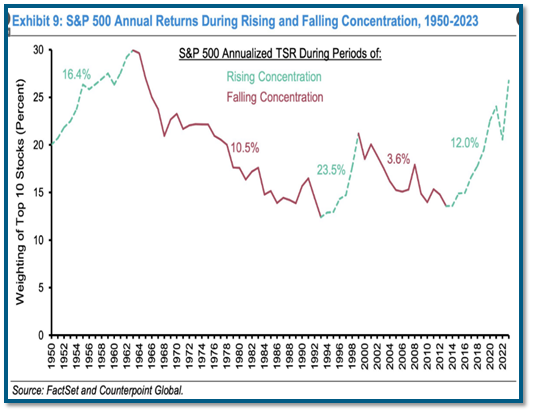
I’ll leave you with this last chart. While market concentration can feel scary, it actually is typical of a bull market expansion. Over time, it only takes 1-2% of global stocks to lead the market forward, which is exactly what we’ve been seeing. And now with expanded market breadth, we feel the signs are there for a continued mid-market cycle growth to continue. Now there is always the potential for a pullback or a “black swan” event, but our goal is to participate when markets are expanding and striking the right balance to protect on the downside in the appropriate allocation for your tolerance for risk.
IMPORTANT DISCLOSURE INFORMATION
Please remember that past performance is no guarantee of future results. Different types of investments involve varying degrees of risk, and there can be no assurance that the future performance of any specific investment, investment strategy, or product (including the investments and/or investment strategies recommended or undertaken by Bouchey Financial Group, Ltd. [“Bouchey Financial”]), or any non-investment related content, made reference to directly or indirectly in this blog will be profitable, equal any corresponding indicated historical performance level(s), be suitable for your portfolio or individual situation, or prove successful. Due to various factors, including changing market conditions and/or applicable laws, the content may no longer be reflective of current opinions or positions. Moreover, no portion of this discussion or information contained in this blog serves as the receipt of, or as a substitute for, personalized investment advice from Bouchey Financial. To the extent that a reader has any questions regarding the applicability of any specific issue discussed above to his/her individual situation, he/she is encouraged to consult with the professional advisor of his/her choosing. Neither Bouchey Financial’s investment adviser registration status, nor any amount of prior experience or success, should be construed that a certain level of results or satisfaction will be achieved if Bouchey Financial is engaged, or continues to be engaged, to provide investment advisory services. Bouchey Financial is neither a law firm nor a certified public accounting firm and no portion of the blog content should be construed as legal or accounting advice. A copy of the Bouchey Financial’s current written disclosure Brochure and Form CRS discussing our advisory services and fees is available for review upon request or at www.bouchey.com. Please Note: Bouchey Financial does not make any representations or warranties as to the accuracy, timeliness, suitability, completeness, or relevance of any information prepared by any unaffiliated third party, whether linked to Bouchey Financial’s web site or blog or incorporated herein, and takes no responsibility for any such content. All such information is provided solely for convenience purposes only and all users thereof should be guided accordingly. Please Remember: If you are a Bouchey Financial client, please contact Bouchey Financial, in writing, if there are any changes in your personal/financial situation or investment objectives for the purpose of reviewing/evaluating/revising our previous recommendations and/or services, or if you would like to impose, add, or to modify any reasonable restrictions to our investment advisory services. Unless, and until, you notify us, in writing, to the contrary, we shall continue to provide services as we do currently. Please Also Remember to advise us if you have not been receiving account statements (at least quarterly) from the account custodian.